|
3D Visualization of Thermal Turbulence
|
|||||
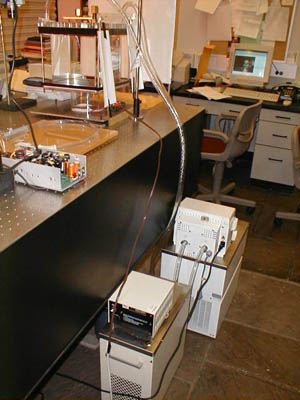
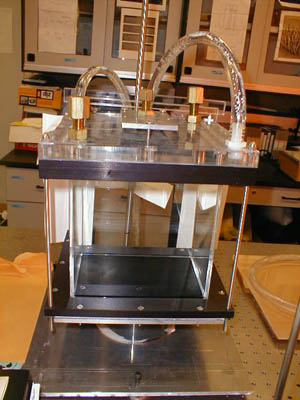
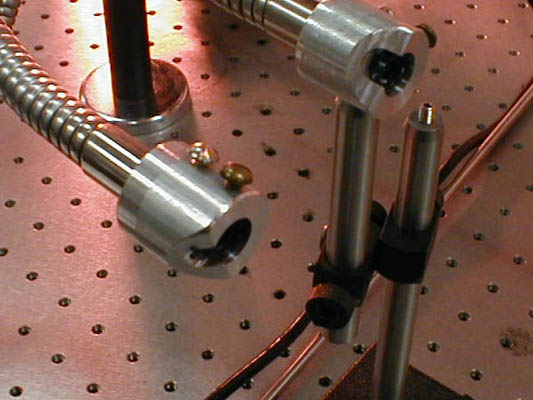
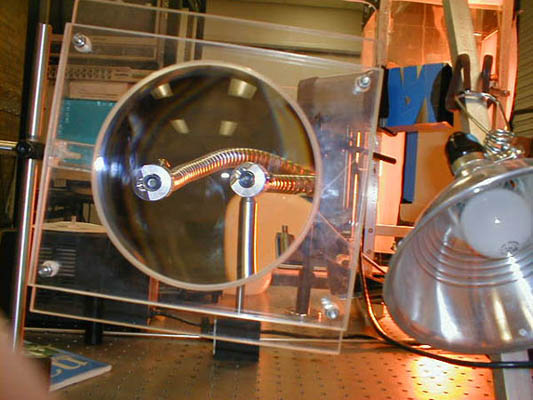
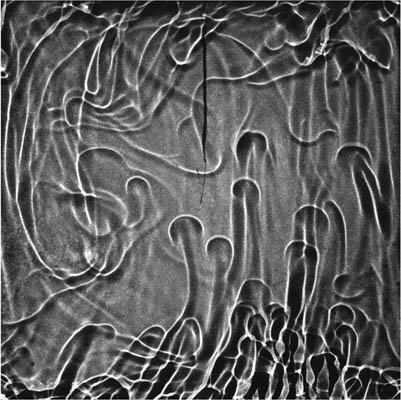
| The traditional shadowgraph technique is very useful for visualizing flow structure in a thermal system. The temperature variations cause density variations, which appear as changes in refractive index. When a parallel beam of light is sent through the system, the convective fluid casts a "shadow" . The 3D information is projected onto a 2D plane, and the structure along the path of the light beam is lost. To recover the full 3D information, we are developing a simple technique that uses two light sources and thus two sets of shadowgraphs. Correlations between the shadowgraphs produced by two separated light sources can be used to obtain three-dimensional information. | |||||
|
|||||
|
|||||
|
|||||
|
|||||
|
|||||
|
|
|||||